Broadcast Orchestration: Traffic, Signups & Revenue Measured
After Broadcast went live August 24, 2026, equal 19-day windows showed +23% visitors, +30% signups, and +13% revenue. Measured with first-party tracker, production DB, Stripe, and Cloudflare corroboration.
Executive summary
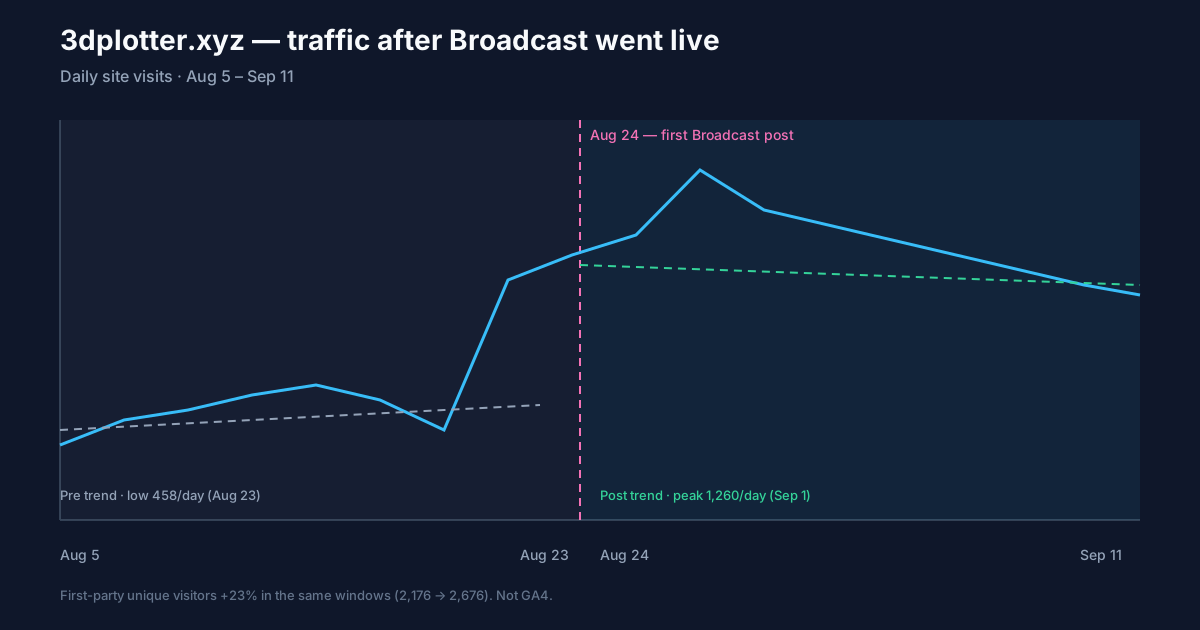
We turned on Reaudit Broadcast for 3dplotter.xyz on August 24, 2026. Comparing equal 19-day windows before and after activation, first-party tracked unique visitors rose from 2,176 to 2,676 (+23%), account signups from 113 to 147 (+30%), and Stripe revenue from €1,395 to €1,582 (+13%) in that window. Lifetime AI-attributed revenue for 3dplotter is now $11,926. Cloudflare edge data corroborated the traffic lift: a low around 458 visitors per day on August 23, a peak near 1,260 around September 1, and a sustained higher band after August 24.
This is a product-led case study of what happened when we turned on Broadcast orchestration. It is not a claim that social publishing alone caused every gain. GEO work from Parts 1–6 continued in parallel.
Broadcast is Reaudit's social publishing layer: one queue across six channels, wired to the first-party tracker so you can see whether a post produced a visit, signup, or sale. The 415 posts queued from the 3dplotter codebase, the August 23 baseline, and the MCP workflow are in Part 7. This article is only the measured results after those posts started going live on August 24, 2026.
What we changed (and what we did not)
No paid campaign, no product changes, no pricing changes. We activated Broadcast for the backlog from Part 7 (14-day launch + 69-feature series) at 07:00 UTC across six platforms. The only deliberate change in the measurement window was turning on orchestration. We compare equal 19-day windows (Aug 5–23, 2026 pre vs Aug 24–Sep 11, 2026 post) and frame the lift as correlation, not causation.
Methodology
All primary metrics come from three sources. We did not use GA4 for this analysis.
| Source | What it measures | Role in this study |
|---|---|---|
| Reaudit first-party tracker | Unique visitors | Primary traffic metric |
| 3dplotter production database | Account signups | Ground truth: real accounts, not form fills |
| Stripe | Transactions + revenue (EUR) | Ground truth: actual payments |
| Cloudflare edge | Request volume / daily visitors | Corroboration only, not identified users |
- Equal windows: 19 days pre (Aug 5–23, 2026) vs 19 days post (Aug 24–Sep 11, 2026).
- Inflection date: Broadcast activation on August 24, 2026.
- No GA4: GA4 is noisy at small sample sizes and often misses bot-heavy traffic. We used the Reaudit tracker for unique visitors.
- Two-system corroboration: Reaudit tracker and Cloudflare both showed the same directional change after August 24.
Interactive results
Use the chart below to switch between metrics. Bars compare the full pre and post windows (first-party tracker for visitors, DB for signups, Stripe for revenue). The line chart shows daily site visits with pre/post trend lines and the August 24 inflection.
Pre window
2,176
Post window
2,676
Change
+23%
Daily site visits
Inflection at Aug 24 (first Broadcast post). Dashed lines show the pre/post trend. First-party unique visitors rose +23% in the same windows (2,176 → 2,676). Not GA4.
The numbers: traffic, signups, and sales
Traffic: +23% unique visitors
| Metric | Pre (Aug 5–23, 2026) | Post (Aug 24–Sep 11, 2026) | Change |
|---|---|---|---|
| Unique visitors (total) | 2,176 | 2,676 | +23% |
| Unique visitors (daily avg) | 115 | 141 | +23% |
The daily average moved from 115 to 141, a meaningful shift for a product at this stage. It showed up in the first-party tracker, not just in edge logs.
Signups: +30% account creations
| Metric | Pre (Aug 5–23, 2026) | Post (Aug 24–Sep 11, 2026) | Change |
|---|---|---|---|
| Account signups (total) | 113 | 147 | +30% |
| Signups (daily avg) | 5.9 | 7.7 | +30% |
| Signup rate (signups ÷ visitors) | 5.2% | 5.5% | ↑ |
Signups come from the production database: real accounts in MongoDB, not form fills or analytics events. A 30% lift in signups on a 23% lift in traffic suggests broadcast posts reached people closer to trying the product, or that the distributed content was more relevant than the baseline traffic mix.
Sales: +13% Stripe revenue (19-day window)
| Metric | Pre (Aug 5–23, 2026) | Post (Aug 24–Sep 11, 2026) | Change |
|---|---|---|---|
| Stripe transactions | 39 | 43 | +10% |
| Stripe revenue | €1,395 | €1,582 | +13% |
Sales moved less than traffic and signups, which is normal. The purchase cycle for a €29.90 tool is not same-day for most users. The 13% revenue lift is the smallest of the three window metrics and would be expected to lag further. Lifetime AI-attributed revenue across the full case study period is now $11,926.
What the Cloudflare data adds
Cloudflare measures edge requests, not identified users. Use it as corroboration, not a substitute for first-party tracking. In this window, the edge dashboard showed the same directional change:
- August 23 (pre): low around 458 visitors/day
- September 1 (post): peak near 1,260 visitors/day
- After August 24: sustained higher traffic band
Two separate systems saw the same inflection.
What Broadcast actually does
Now that you have the numbers, here is the product context. Broadcast connects to X, LinkedIn, Instagram, Facebook, TikTok, and YouTube from one queue inside Reaudit, alongside AI visibility tracking, content generation, and attribution. Most social tools stop at publishing; Broadcast ties each post back to visits, signups, and sales in the same dashboard.
The workflow we used for 3dplotter:
- Generate or write posts in Reaudit, or via MCP from your harness.
- Add to the Broadcast queue with date, time, and channels.
- Publish on schedule across all six platforms.
- Read traffic, signups, and Stripe revenue in the tracker.
Broadcast queue
IMAGE placeholder · broadcast-queue-dashboard
Screenshot: 3dplotter posts in the Reaudit Broadcast calendar (Aug 24 onward).
 TikTok
 X
XHow to measure social publishing results properly
If you are trying to track engagement from broadcast social posts, the measurement setup matters more than the posting cadence. Here is the approach we used:
- Use first-party tracking, not GA4 alone. GA4 is useful for aggregate trends but noisy at small sample sizes. A first-party tracker that identifies unique visitors gives a cleaner denominator.
- Pull signups from the production database. Form fills and analytics events can be inflated. Account creations are ground truth.
- Pull revenue from Stripe or your payment processor. Do not infer sales from analytics.
- Use edge data as corroboration. Cloudflare, Fastly, or your CDN can confirm a traffic change was not isolated to one tracking system.
- Compare equal windows. We used 19 days before and 19 days after. Unequal windows make the comparison meaningless.
If the numbers only exist in one dashboard, they are easy to dismiss. This is how you measure social media broadcast performance in a way that survives scrutiny.
Broadcast in the context of AI search visibility
Social publishing and AI search visibility are different channels, but they share a dependency: both reward consistent, well-structured content. AI engines cite pages that are clear, specific, and updated. Social platforms reward the same thing with different distribution mechanics. When you publish from the same content system that produces your AI-optimized pages, you reduce the coordination cost of doing both.
That is the argument for putting Broadcast inside Reaudit rather than treating it as a separate tool. The content engine produces the post, GEO scoring tells you whether it is likely to be cited, Broadcast distributes it, and the tracker measures what came back. For teams already investing in AI search visibility, this is the practical version of cross-platform publishing: not just posting everywhere, but posting from the same source of truth that drives your AI visibility. Pair it with Reaudit MCP to queue content from your harness without leaving your editor.
What we are not claiming
- GEO work predates this experiment and continued independently. We are not claiming Broadcast caused every gain in AI search visibility or lifetime revenue.
- We did not run a holdout or split test. Next step: broadcast a subset of content and compare against a matched set that is not broadcast.
- Cloudflare edge data measures requests, not identified users. We cite it as corroboration only.
- What we can say: after we turned on Broadcast orchestration, traffic, signups, and sales all moved up in the same 19-day window. That is a correlation worth testing further, not a controlled causal result.
Key takeaways
- Broadcast moved the needle on all three funnel stages in 19 days. Traffic +23%, signups +30%, sales +13% in the measured window.
- The lift was confirmed by two independent systems. Reaudit first-party tracker and Cloudflare edge data both showed a sustained increase after August 24.
- Sales lagged traffic and signups, as expected. Purchase cycles are longer than visit cycles.
- No ads, no product changes, no pricing changes. The only deliberate change was turning on Broadcast orchestration.
- Measurement discipline is the hard part. First-party tracking + production database + Stripe is the minimum viable stack for a credible result.
Screenshots and session recordings
We will add production screenshots and harness session recordings below as they are captured. Assets go in public/case-studies/3dplotter/showcase/ and are wired in lib/case-studies/3dplotter-showcase-data.ts.
Stripe attribution
IMAGE placeholder · stripe-attribution
Screenshot: Reaudit revenue attribution tying social posts to Stripe conversions.
Cursor + Broadcast MCP
VIDEO placeholder · cursor-broadcast-session
Video: agent scheduling the Sep 2026 promo wave from Cursor.
What to do next
If you want to test this on your own product, start with a clean baseline. Pick a 19-day or 30-day window, record unique visitors from a first-party tracker, signups from your database, and revenue from your payment processor. Then turn on Broadcast and schedule a modest cadence from your existing content. Do not change anything else. Compare the next equal window.
If you are already doing GEO work, Broadcast is the distribution layer that keeps your content in front of humans while AI engines learn to cite it. If you are not doing GEO work yet, start there, then add Broadcast once you have content worth distributing.
Learn more on the Broadcast product page and the MCP setup guide.
Frequently asked questions
What is Reaudit Broadcast?
Broadcast is Reaudit's social publishing and distribution layer. It connects to X, LinkedIn, Instagram, Facebook, YouTube, and TikTok, lets you schedule posts, and publishes them across channels from one queue. It sits inside Reaudit alongside AI visibility tracking, content generation, and attribution.
What were the broadcast social publishing results for 3dplotter?
In the 19 days after Broadcast was turned on (Aug 24–Sep 11, 2026), 3dplotter saw unique visitors rise 23% (2,176 to 2,676), account signups rise 30% (113 to 147), and Stripe revenue rise 13% (€1,395 to €1,582) compared to the prior 19-day window. Lifetime AI-attributed revenue is now $11,926.
How do you measure social media broadcast performance?
Use first-party tracking for unique visitors, your production database for signups, and your payment processor for revenue. Compare equal-length windows before and after activation. Edge data from Cloudflare can corroborate the traffic change but should not be the primary source.
Did Broadcast cause the traffic and sales increase?
We frame it as correlation, not causation. Broadcast was the only deliberate change in the window, and two independent systems showed the same lift. But we did not run a holdout test, and GEO work predating the experiment continued as normal.
What is the best way to publish content across all social channels?
Use a single queue that publishes to multiple channels on a schedule, and connect it to the same measurement system you use for the rest of your funnel. Publishing everywhere is easy; knowing what worked is the hard part. Broadcast is built to do both inside Reaudit.
Does social publishing help AI search visibility?
Not directly. AI engines cite pages, not social posts. But social distribution and AI visibility both reward consistent, well-structured content. Publishing from the same system that produces your AI-optimized pages reduces coordination cost and keeps content in front of humans while AI engines learn to cite it.
What should I do before turning on Broadcast?
Establish a clean baseline: pick a window, record unique visitors from a first-party tracker, signups from your database, and revenue from Stripe. Then turn on Broadcast and change nothing else. Compare the next equal window to isolate the effect.