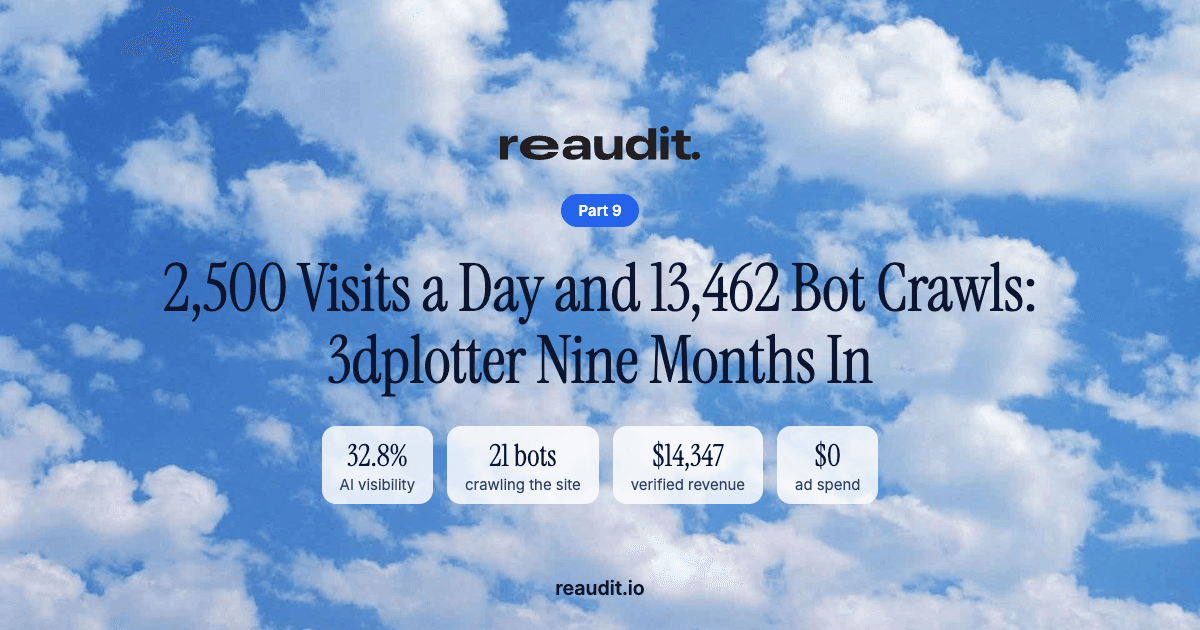
Nine months after launch, 3dplotter.xyz averages 2,497 visits a day at the Cloudflare edge, was crawled 13,462 times by 21 search and AI bots in 31 days, nearly doubled its AI visibility to 32.8%, and has $14,347 in Stripe-verified revenue. Zero ad spend.
2,497
visits a day at the edge
13,462
bot crawls in 31 days
32.8%
of tracked AI answers name 3dplotter
$14,347
Stripe-verified revenue, $0 on ads
The short version
In Part 8 we measured what happened when Broadcast went live: Cloudflare showed a low of about 458 visits a day on August 23 and a peak near 1,260 on September 1. A month later the old peak is the floor. Between September 14 and October 13, 3dplotter.xyz averaged 2,497 visits a day, and not one day fell below 1,898.
The machines noticed too. In the same 31 days, 21 different search and AI bots made 13,462 requests: ClaudeBot, GPTBot, Applebot, PerplexityBot, OAI-SearchBot, Googlebot and more. ChatGPT, Claude, Perplexity and Mistral fetched pages live 2,786 times while answering someone's question. And the share of tracked AI answers that name 3dplotter jumped from 14.5% to 32.8% in one month.
3dplotter is a €29.90 web app that turns a 3D printer into a pen plotter. It launched on January 19, 2026, has never bought an ad, and has $14,347 in revenue verified through Stripe on TrustMRR. Every part of the growth engine runs on Reaudit.
Explore the numbers
Switch between visits, bot crawls, AI visibility and revenue. Every chart uses data pulled on October 14, 2026, from the same sources a Reaudit customer sees in their dashboard.
Edge visits, 30 days
74,897
Average per day
2,497
vs Aug 23 low
5.5×
Daily edge visits, Sep 14 – Oct 13, 2026
Source: Cloudflare edge analytics for 3dplotter.xyz. Every day in the window was above the old Part 8 peak.
Visits per day, then and now
1. Traffic: the old peak is now the floor
| Checkpoint | Edge visits per day | Source |
|---|---|---|
| Aug 23, 2026 (day before Broadcast) | 458 | Part 8, Cloudflare |
| Sep 1, 2026 (Part 8 peak) | ~1,260 | Part 8, Cloudflare |
| Sep 14 – Oct 13, 2026 (30-day average) | 2,497 | Cloudflare |
| Lowest day in that window (Sep 14) | 1,898 | Cloudflare |
| Highest day in that window (Oct 7) | 3,004 | Cloudflare |
That is roughly 5.5 times the pre-Broadcast low, held for a whole month rather than a single spike.
Nothing else changed in the stack: no ads, no outbound, no new channel. The pages AI engines were trained to trust in Part 1, the prompts tracked since Part 3 and the posts queued from the codebase in Part 7 kept compounding.
2. Bot crawls: 21 bots, 13,462 requests, and rising
Most founders never look at who crawls their site. For AI visibility it is the first thing to check: if ChatGPT, Claude and Perplexity cannot read a page, they cannot cite it. Reaudit connects to Cloudflare and sorts every bot request by why it came:
| Why the bot came | Bots | Requests |
|---|---|---|
| AI model crawlers (learning the site) | ClaudeBot, Applebot, Amazonbot, Bytespider, GPTBot, CCBot, Meta, Google-Extended, Cohere | 6,271 |
| Search engines | Googlebot, Bingbot, PetalBot | 2,966 |
| Live fetches for a person asking a question | ChatGPT-User, Claude-User, Perplexity-User, DuckAssistBot, MistralAI-User, Meta fetcher | 2,786 |
| AI search indexers | OAI-SearchBot, PerplexityBot, Claude-SearchBot | 1,439 |
The third row is the one to watch. 2,786 times in a month, an assistant opened a 3dplotter page in real time because a person asked it something about pen plotting. That is the closest thing AI search has to an impression, and it does not show up in Google Analytics at all.
The pace is rising: about 365 bot requests a day in the second half of September and about 519 a day in October, a 42% increase. And the bots read what we built for them. After robots.txt and the homepage, the most requested files were sitemap.xml and llm-sitemap.xml, the machine-readable map we added in Part 1:
| Path | Bot requests |
|---|---|
| /robots.txt | 862 |
| / | 396 |
| /sitemap.xml | 354 |
| /llm-sitemap.xml | 351 |
| /guides/bambu-lab-a1 | 64 |
| /blog | 63 |
| /supported-printers/bambu-lab-a1 | 55 |
| /how-it-works | 52 |
| /guides/bambu-lab-h2s | 51 |
| /guides/bambu-lab-p1s | 47 |
The printer guides (Bambu Lab A1, H2S, P1S) are crawled more than any marketing page. They are also among the pages that sell: the Bambu Lab guides and printer pages appear again and again as landing pages before a purchase.
3. AI visibility: nearly doubled in a month
| 30-day window | Answers naming 3dplotter | AI visibility |
|---|---|---|
| Jul 16 – Aug 14 | 76 of 360 | 21.1% |
| Aug 15 – Sep 13 | 69 of 477 | 14.5% |
| Sep 14 – Oct 14 | 166 of 506 | 32.8% |
We are not hiding the dip: from mid-August to mid-September visibility fell to 14.5%. Daily tracking showed it as it happened, prompt by prompt and engine by engine, and the following month it climbed to its highest level yet: 166 mentions in 506 answers, against 69 the month before.
- ChatGPT: 28 → 60 mentions
- Perplexity: 17 → 55 mentions
- Google AI: 24 → 51 mentions
- Citation rate 91%: when an engine names 3dplotter, it almost always links to it
- Sentiment 81/100: 125 positive answers, 5 negative
Over 90 days, AI answers to 3dplotter's prompts carried 2,999 citations. The single most-cited domain is 3dplotter.xyz itself (530), ahead of YouTube (262), Reddit (242), Instructables (100) and GitHub (89). For a nine-month-old product, owning the top source in its own category is the whole game.
4. Revenue: $14,347, verified, no ads
| Checkpoint | Cumulative revenue |
|---|---|
| Launch, Jan 19, 2026 | $0 |
| Part 6, May 21, 2026 | $3,478 |
| Part 8, Sep 12, 2026 | $11,926 |
| Part 9, Oct 14, 2026 | $14,347 |
The product is a €29.90 one-time purchase, so this is hundreds of individual buyers, not a few large deals. Buyers in the United States, Germany and the United Kingdom lead, and the typical buyer converts about a week after their first visit, often after coming back through an AI assistant or an AI-first search engine such as DuckDuckGo, Brave or Kagi.
One honest note: traffic grew much faster than sales this month. Revenue has held at roughly $2,000 a month while visits multiplied. More visitors are not automatically more buyers, and the next job is conversion work on the pages that now get the attention. Reaudit's page-level attribution already shows which ones those are.
What Reaudit did, in one list
- Built the site to be read by machines from the first commit, with Reaudit MCP in Cursor: schema, answer-first pages,
llms.txtand an LLM sitemap (Part 1). - Tracked the prompts buyers actually ask across ChatGPT, Perplexity and Google AI every day (Part 3).
- Published from the same source of truth: articles, guides and 415 social posts generated from the codebase (Part 7, Broadcast).
- Watched the bots through the Cloudflare connection: which ones come, what they read, and whether they come back.
- Tied it to money: visits, AI referrals and Stripe payments in one attribution view.
What this means for your brand
3dplotter is a small product in a small niche. If it can reach 2,500 visits a day, a 91% citation rate and the top-cited domain in its category without ad spend, the method works for brands with real budgets and real teams. Three questions every marketing lead should be able to answer today:
- Which AI bots crawl your site, and which pages do they skip? If you cannot answer this, AI engines are forming an opinion of you without you.
- In what share of AI answers in your category is your brand named? For 3dplotter it is now 32.8%. Do you know your number, and your competitors'?
- Which domain do AI engines cite when they answer your buyers? If it is a marketplace, a forum or a competitor, that is where your next sale is going.
Reaudit answers all three in your first session. Connect Cloudflare, add your prompts, and you get the same dashboards that produced every number on this page. Start with the pricing page, or book a call below and we will run your brand live.
How we measured
- Visits and bot crawls: Cloudflare edge analytics through Reaudit's Cloudflare connection, September 14 to October 14, 2026 (the 31 days Cloudflare keeps on this plan). Daily visits use the 30 full days; October 14 was still in progress.
- Bots are matched by user agent. A small share of requests used AI user agents to probe for files like
.env, which real assistants do not do, so per-bot numbers are upper bounds. Edge visits are not identified people. - AI visibility: Reaudit's daily prompt tracking on ChatGPT, Perplexity and Google AI. Windows are derived from the 30-, 60- and 90-day scores on October 14. The 30-day score has a 95% confidence interval of ±4.1 points.
- Revenue: Stripe, as published on TrustMRR. AI attribution per sale is a correlation (visit source and timing), not a guarantee, which is why we headline the total.
Frequently asked questions
How much traffic does 3dplotter get now?
Between September 14 and October 13, 2026, 3dplotter.xyz averaged 2,497 visits a day at the Cloudflare edge (74,897 in 30 days), up from about 458 a day on August 23.
Which AI bots crawl 3dplotter.xyz?
21 bots in 31 days, led by Googlebot (1,619 requests), ClaudeBot (1,446), Applebot (1,010), ChatGPT-User (894), Amazonbot (879), GPTBot (745) and PerplexityBot (717). In total they made 13,462 requests.
What is a live fetch by an AI assistant?
When someone asks ChatGPT, Claude or Perplexity a question and the assistant opens a web page to answer it, the request arrives with a user agent such as ChatGPT-User or Claude-User. 3dplotter received 2,786 of these in 31 days. Reaudit shows them separately from training crawlers because they mean a real person asked.
How do I see which AI bots crawl my site?
Connect Cloudflare in Reaudit. You get bot crawls grouped by operator and purpose, the pages each bot reads, live assistant fetches and AI referral traffic, next to your AI visibility and revenue.
Did 3dplotter spend money on ads?
No. $0 on Google, Meta, TikTok, Reddit or any other paid channel since launch. Revenue is $14,347, verified through Stripe on TrustMRR.